
In my previous post, I documented learning dynamic pricing concepts - understanding elasticity and the mental models behind pricing strategy. I understood the theory and formulas, but I hadn't actually built the analysis yet.
That's where this chapter begins.
Before writing any Python code, I made a deliberate choice: build this analysis completely in Excel first.
Why? To prove I understand the formulas, see the data visually, validate my logic, and demonstrate Excel proficiency - a skill many business roles expect.
This wasn't about avoiding Python. This was about building a solid foundation.
I opened my four CSV datasets and started building:
Step 1: Understanding the Data
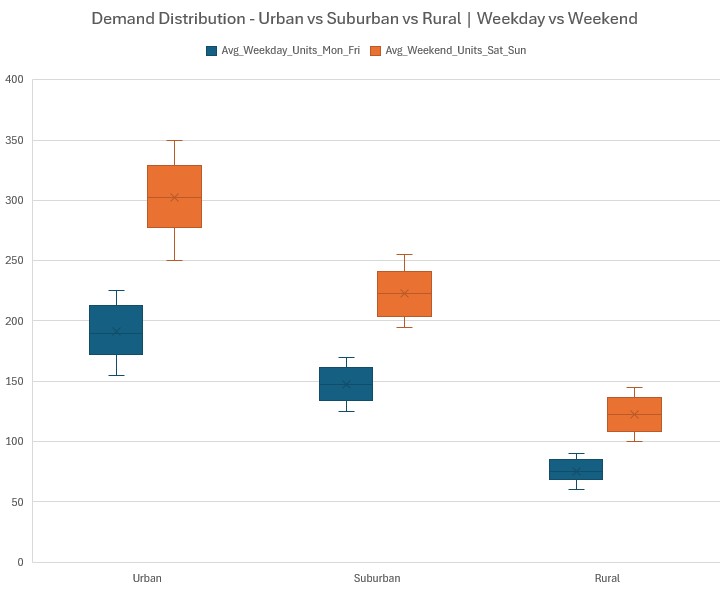
30 stores across Urban/Suburban/Rural locations
Current price: $4.00 (uniform)
Weekday and weekend demand data
I created a box plot visualization and the insight hit me immediately: Urban weekend demand (~280-330 units) is MASSIVE compared to rural weekday demand (~100-140 units). This isn't a one-size-fits-all pricing problem.
Step 2: Baseline Revenue I calculated baseline revenue for all 30 stores:
Weekday Revenue: $16,560
Weekend Revenue: $25,920
Total Weekly Revenue: $42,480
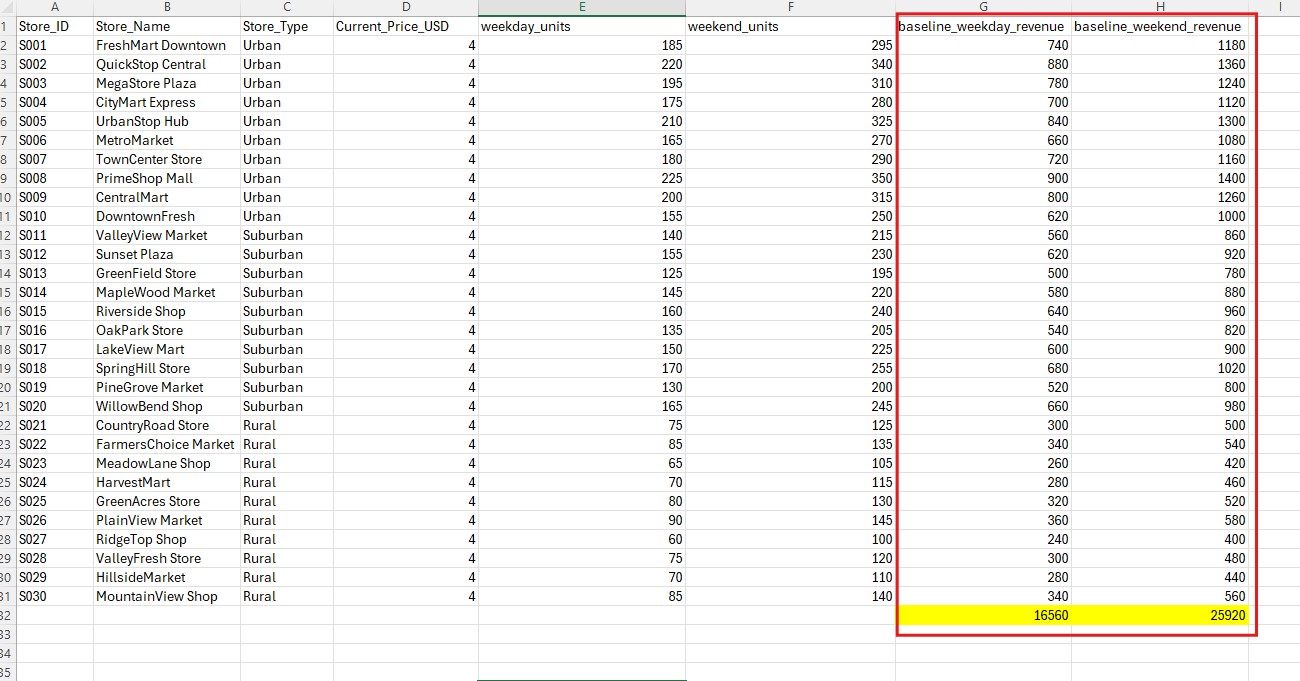
This became my benchmark.
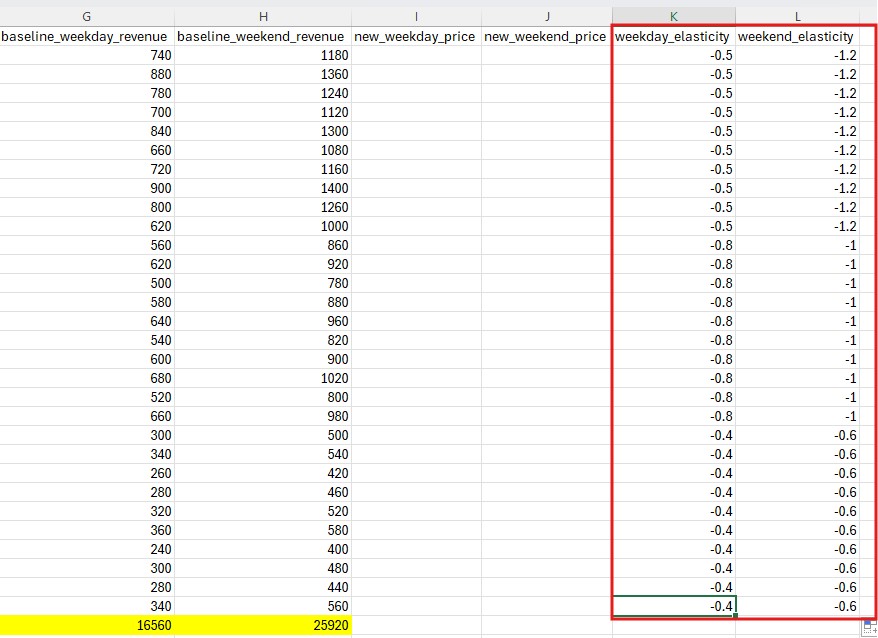
Step 3: Mapping Elasticity I added elasticity coefficients to each store:
Urban: Weekday -0.5, Weekend -1.2
Suburban: Weekday -0.8, Weekend -1.0
Rural: Weekday -0.4, Weekend -0.6
Step 4: Designing My Strategy Based on elasticity insights:
Urban: Weekday $4.20 (+5%), Weekend $3.80 (-5%)
Suburban: Weekday $4.00 (0%), Weekend $3.90 (-2.5%)
Rural: Weekday $4.40 (+10%), Weekend $4.00 (0%)
Step 5: Calculating New Demand I applied the elasticity formula:
New Demand = Original Demand × (1 + (Price Change % × Elasticity))
For Urban store S001:
Weekday: 185 × (1 + (0.05 × -0.5)) = 180.4 units
Weekend: 295 × (1 + (-0.05 × -1.2)) = 312.7 units
Step 6: The Results New revenue totals:
Weekday: $16,910.57
Weekend: $26,020.87
Total: $42,931.44
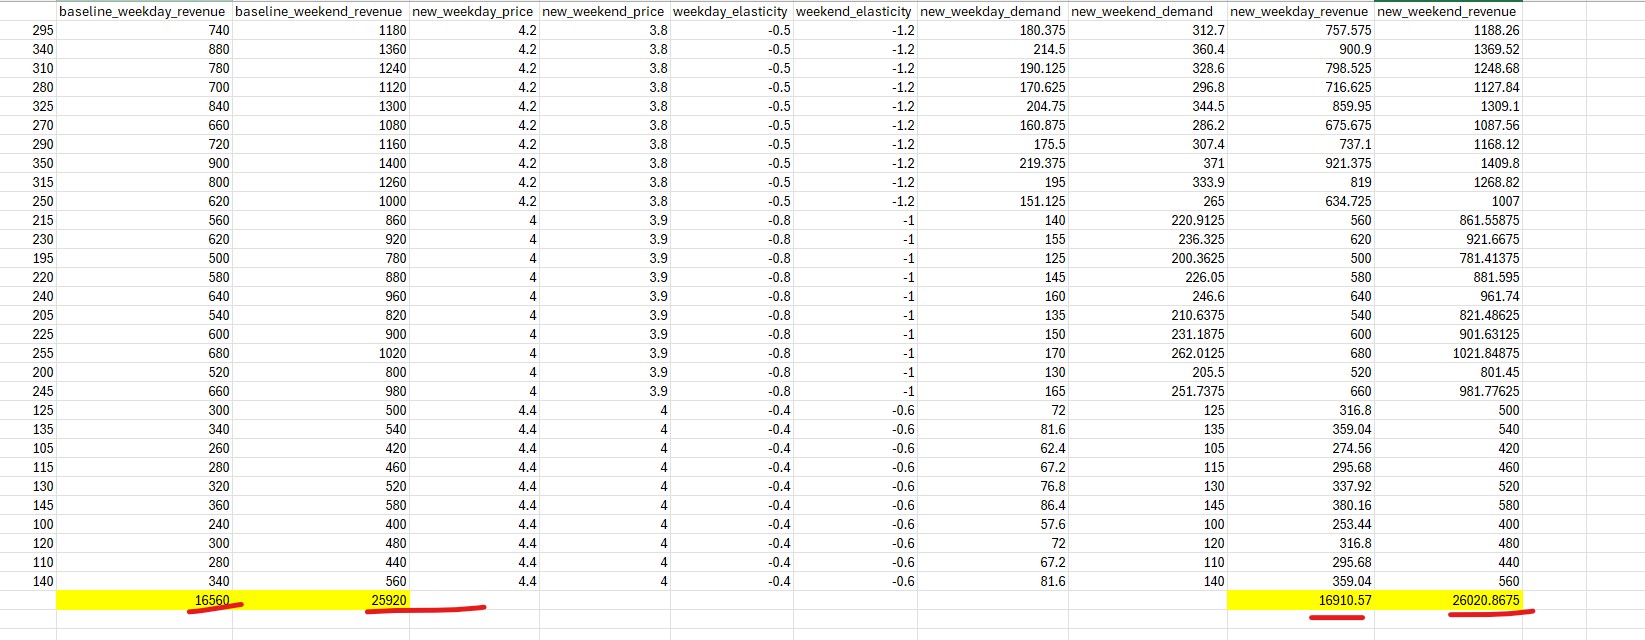
Revenue gain: $451.44 (+1.06%)
It worked! More importantly, I understood WHY:
Rural weekday prices up 10% → lost only 2.4% demand → revenue increased
Urban weekend prices down 5% → gained 6% demand → revenue increased
The elasticity-guided strategy worked exactly as theory predicted
I had a working analysis, but I noticed problems:
Manual scenario testing: Testing different price points meant manually editing cells, recalculating, copying results - tedious and error-prone
Hard to share: Email an Excel file? Walk through formulas on a call? Not exactly impressive
No real-time experimentation: If asked "What happens at $4.50?" in an interview, I'd fumble through Excel - awkward
I asked myself: "How do professional data analysts handle this?"
The answer: They automate the analysis with code.
I decided to build a PricingEngine class - a reusable module that could load data automatically, calculate scenarios on demand, generate insights, and be used by other programs.
This felt more professional. More like real software engineering.
Note : Given that I had already understood the fundamentals and worked out manually in Excel, I wanted to speed up the automation and hence relied on my buddy Claude Code to generate below Python code
Structure:
class PricingEngine:
    def __init__(self, data_folder="excel-problem"):
        self.load_data()
Core Formula (Excel → Python):
def calculate_new_demand(self, original_demand, old_price, new_price, elasticity):
    price_change_pct = (new_price - old_price) / old_price
    demand_multiplier = 1 + (price_change_pct * elasticity)
    return original_demand * demand_multiplier
This is the exact same math I did in Excel, just wrapped in a reusable Python function.
Running Scenarios:
def run_pricing_scenario(self, pricing_strategy):
    # Takes: {'Urban': {'weekday': 4.2, 'weekend': 3.8}, ...}
    # Returns: detailed revenue results
The beauty: I can now test different scenarios by just changing dictionary values. No manual Excel edits.
I ran my test:
engine = PricingEngine()
results = engine.run_pricing_scenario(strategy)
Output:
Baseline total revenue: $42,480.00
New total revenue: $42,931.44
IT MATCHED MY EXCEL ANALYSIS EXACTLY. That validation moment felt incredible.
I had a working pricing engine, but it was command-line based. I wanted something better - something interactive.
Streamlit is a Python library that turns data scripts into interactive web apps with almost no web development knowledge needed.
Instead of learning HTML, CSS, JavaScript, React... I could build a dashboard using just Python.
I created app.py:
import streamlit as st
from pricing_engine import PricingEngine

st.title("🧃 FreshJuice Dynamic Pricing Optimizer")
Ran it: streamlit run app.py
A browser window opened with my title displayed. Magic.
Added sliders:
urban_weekday = st.sidebar.slider(
    "Urban Weekday Price",
    min_value=3.0,
    max_value=5.0,
    value=4.2,
    step=0.1,
    format="$%.2f"
)
I added 6 sliders (3 store types × 2 time periods).
Connected to engine:
pricing_strategy = {
    'Urban': {'weekday': urban_weekday, 'weekend': urban_weekend},
    # ... other store types
}
results = engine.run_pricing_scenario(pricing_strategy)
Every time I moved a slider, the entire analysis re-ran automatically.
Displayed results:
st.metric(
    label="Total Weekly Revenue",
    value=f"${summary['new_total_revenue']:,.2f}",
    delta=f"{summary['total_change']:.2f}"
)
Added interactive charts using Plotly for visualizing baseline vs new strategy.
Every slider movement re-ran the entire script, reloading CSVs each time - slow and inefficient.
Solution: @st.cache_resource to load the engine once and reuse it. Massive performance improvement.
Raw numbers displayed as 42931.44 instead of $42,931.44.
Solution: Format before displaying: display_df['Revenue'].apply(lambda x: f"${x:,.2f}")
Wanted quick preset buttons, but sliders don't automatically respond to programmatic changes. Used st.session_state and st.rerun() as a workaround.
After several hours of coding, I had a fully functional interactive dashboard with:
Sidebar controls with 6 pricing sliders
Real-time metrics showing revenue impact
Comparison charts (baseline vs new strategy)
Store type breakdown analysis
Store-level details with filters
Automated insights generator
CSV export functionality
Python Classes and code structure
Pandas for data manipulation
Streamlit for interactive web apps
Plotly for visualizations
Performance optimization with caching
Separation of concerns (logic vs interface)
User experience design
Validation through incremental testing
Foundation first (Excel validated understanding)
Incremental complexity (Engine → Dashboard)
Test early and often
Some might ask: "Why not just build the dashboard from the start?"
Here's why my approach worked:
1. Excel Forced Understanding Building formulas manually meant I couldn't hide behind code I didn't understand. When the dashboard showed results, I knew exactly how those numbers were calculated.
2. Python Made It Scalable Testing 100 different scenarios in Excel vs moving sliders 100 times? Automation wins.
3. Streamlit Made It Shareable Interactive demonstrations are WAY more impressive than Excel files.
Build the analysis manually first. Understand the logic. Then automate.
I created a business scenario (FreshJuice pricing) and built datasets to solve it. This approach forces critical thinking.
This blog solidified my understanding. When I interview, I can walk through my thought process clearly.
Excel, Python, Streamlit - the real skill is analytical thinking. I could rebuild this in R, Tableau, or Power BI - the logic stays the same.
My dashboard has rough edges, but it works. It's shippable. And I learned by shipping it.
Three weeks ago, I barely understood what price elasticity meant.
Today, I have:
A working pricing analysis in Excel
A reusable pricing engine in Python
An interactive dashboard in Streamlit
A deep understanding of dynamic pricing strategy
When I walk into my next interview and say "I built a dynamic pricing optimizer with an interactive dashboard" - I won't be bluffing.
I'll know exactly what I built and why.
And that confidence? That's worth more than any certification.

New engineers shouldn't learn Docker like they're defusing a bomb. Here's how we created a fear-free learning environment—and cut training time in half." (165 characters)

A complete beginner’s guide to data quality, covering key challenges, real-world examples, and best practices for building trustworthy data.
Explore the power of Databricks Lakehouse, Delta tables, and modern data engineering practices to build reliable, scalable, and high-quality data pipelines."
Ever wonder how Netflix instantly unlocks your account after payment, or how live sports scores update in real-time? It's all thanks to Change Data Capture (CDC). Instead of scanning entire databases repeatedly, CDC tracks exactly what changed. Learn how it works with real examples.
A real-world Terraform war story where a “simple” Azure SQL deployment spirals into seven hard-earned lessons, covering deprecated providers, breaking changes, hidden Azure policies, and why cloud tutorials age fast. A practical, honest read for anyone learning Infrastructure as Code the hard way.

Data doesn’t wait - and neither should your insights. This blog breaks down streaming vs batch processing and shows, step by step, how to process real-time data using Azure Databricks.

A curious moment while shopping on Amazon turns into a deep dive into how Rufus, Amazon’s AI assistant, uses Generative AI, RAG, and semantic search to deliver real-time, accurate answers. This blog breaks down the architecture behind conversational commerce in a simple, story-driven way.

This blog talks about Databricks’ Unity Catalog upgrades -like Governed Tags, Automated Data Classification, and ABAC which make data governance smarter, faster, and more automated.

Tired of boring images? Meet the 'Jai & Veeru' of AI! See how combining Claude and Nano Banana Pro creates mind-blowing results for comics, diagrams, and more.
An honest, first-person account of learning dynamic pricing through hands-on Excel analysis. I tackled a real CPG problem : Should FreshJuice implement different prices for weekdays vs weekends across 30 retail stores?

What I thought would be a simple RBAC implementation turned into a comprehensive lesson in Kubernetes deployment. Part 1: Fixing three critical deployment errors. Part 2: Implementing namespace-scoped RBAC security. Real terminal outputs and lessons learned included

This blog walks you through how Databricks Connect completely transforms PySpark development workflow by letting us run Databricks-backed Spark code directly from your local IDE. From setup to debugging to best practices this Blog covers it all.

This blog unpacks how brands like Amazon and Domino’s decide who gets which coupon and why. Learn how simple RFM metrics turn raw purchase data into smart, personalised loyalty offers.
Learn how Snowflake's Query Acceleration Service provides temporary compute bursts for heavy queries without upsizing. Per-second billing, automatic scaling.

A simple ETL job broke into a 5-hour Kubernetes DNS nightmare. This blog walks through the symptoms, the chase, and the surprisingly simple fix.
A data engineer started a large cluster for a short task and couldn’t stop it due to limited permissions, leaving it idle and causing unnecessary cloud costs. This highlights the need for proper access control and auto-termination.

Say goodbye to deployment headaches. Learn how Databricks Asset Bundles keep your pipelines consistent, reproducible, and stress-free—with real-world examples and practical tips for data engineers.

Tracking sensitive data across Snowflake gets overwhelming fast. Learn how object tagging solved my data governance challenges with automated masking, instant PII discovery, and effortless scaling. From manual spreadsheets to systematic control. A practical guide for data professionals.

My first hand experience learning the essential concepts of Dynamic pricing

Running data quality checks on retail sales distribution data
This blog explores my experience with cleaning datasets during the process of performing EDA for analyzing whether geographical attributes impact sales of beverages

Snowflake recommends 100–250 MB files for optimal loading, but why? What happens when you load one large file versus splitting it into smaller chunks? I tested this with real data, and the results were surprising. Click to discover how this simple change can drastically improve loading performance.

Master the bronze layer foundation of medallion architecture with COPY INTO - the command that handles incremental ingestion and schema evolution automatically. No more duplicate data, no more broken pipelines when new columns arrive. Your complete guide to production-ready raw data ingestion

Learn Git and GitHub step by step with this complete guide. From Git basics to branching, merging, push, pull, and resolving merge conflicts—this tutorial helps beginners and developers collaborate like pros.

Discover how data management, governance, and security work together—just like your favorite food delivery app. Learn why these three pillars turn raw data into trusted insights, ensuring trust, compliance, and business growth.
Beginner’s journey in AWS Data Engineering—building a retail data pipeline with S3, Glue, and Athena. Key lessons on permissions, data lakes, and data quality. A hands-on guide for tackling real-world retail datasets.

A simple request to automate Google feedback forms turned into a technical adventure. From API roadblocks to a smart Google Apps Script pivot, discover how we built a seamless system that cut form creation time from 20 minutes to just 2.

Step-by-step journey of setting up end-to-end AKS monitoring with dashboards, alerts, workbooks, and real-world validations on Azure Kubernetes Service.

My learning experience tracing how an app works when browser is refreshed

Demonstrates the power of AI assisted development to build an end-to-end application grounds up
A hands-on learning journey of building a login and sign-up system from scratch using React, Node.js, Express, and PostgreSQL. Covers real-world challenges, backend integration, password security, and key full-stack development lessons for beginners.

This is the first in a five-part series detailing my experience implementing advanced data engineering solutions with Databricks on Google Cloud Platform. The series covers schema evolution, incremental loading, and orchestration of a robust ELT pipeline.

Discover the 7 major stages of the data engineering lifecycle, from data collection to storage and analysis. Learn the key processes, tools, and best practices that ensure a seamless and efficient data flow, supporting scalable and reliable data systems.

This blog is troubleshooting adventure which navigates networking quirks, uncovers why cluster couldn’t reach PyPI, and find the real fix—without starting from scratch.

Explore query scanning can be optimized from 9.78 MB down to just 3.95 MB using table partitioning. And how to use partitioning, how to decide the right strategy, and the impact it can have on performance and costs.

Dive deeper into query design, optimization techniques, and practical takeaways for BigQuery users.

Wondering when to use a stored procedure vs. a function in SQL? This blog simplifies the differences and helps you choose the right tool for efficient database management and optimized queries.

Discover how BigQuery Omni and BigLake break down data silos, enabling seamless multi-cloud analytics and cost-efficient insights without data movement.

In this article we'll build a motivation towards learning computer vision by solving a real world problem by hand along with assistance with chatGPT

This blog explains how Apache Airflow orchestrates tasks like a conductor leading an orchestra, ensuring smooth and efficient workflow management. Using a fun Romeo and Juliet analogy, it shows how Airflow handles timing, dependencies, and errors.

The blog underscores how snapshots and Point-in-Time Restore (PITR) are essential for data protection, offering a universal, cost-effective solution with applications in disaster recovery, testing, and compliance.

The blog contains the journey of ChatGPT, and what are the limitations of ChatGPT, due to which Langchain came into the picture to overcome the limitations and help us to create applications that can solve our real-time queries

This blog simplifies the complex world of data management by exploring two pivotal concepts: Data Lakes and Data Warehouses.

demystifying the concepts of IaaS, PaaS, and SaaS with Microsoft Azure examples

Discover how Azure Data Factory serves as the ultimate tool for data professionals, simplifying and automating data processes

Revolutionizing e-commerce with Azure Cosmos DB, enhancing data management, personalizing recommendations, real-time responsiveness, and gaining valuable insights.
Highlights the benefits and applications of various NoSQL database types, illustrating how they have revolutionized data management for modern businesses.

This blog delves into the capabilities of Calendar Events Automation using App Script.
Dive into the fundamental concepts and phases of ETL, learning how to extract valuable data, transform it into actionable insights, and load it seamlessly into your systems.

An easy to follow guide prepared based on our experience with upskilling thousands of learners in Data Literacy

Teaching a Robot to Recognize Pastries with Neural Networks and artificial intelligence (AI)

Streamlining Storage Management for E-commerce Business by exploring Flat vs. Hierarchical Systems

Figuring out how Cloud help reduce the Total Cost of Ownership of the IT infrastructure

Understand the circumstances which force organizations to start thinking about migration their business to cloud