.webp&w=3840&q=75)
In this project, you will step into the shoes of a Sports Data Engineer to build the end-to-end pipeline used by professional franchise front offices. You aren’t just making charts; you are building a "Single Source of Truth" that turns messy, raw match data into high stakes strategic insights.
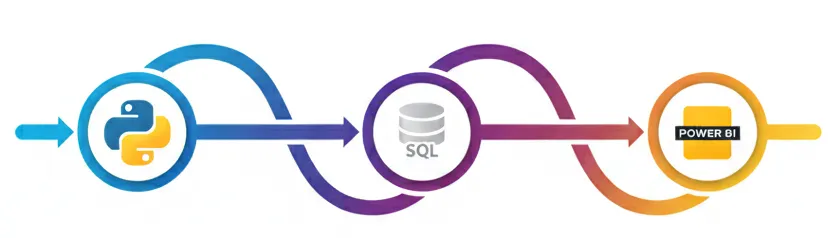
This project is divided into three distinct phases, mirroring real world analytics engineering workflows:
Phase 1: Data Engineering with Python Raw IPL data is rarely "analysis ready." You will start by using Python to perform Data Cleaning and Standardization. You will handle missing values, resolve naming inconsistencies (like team name changes), and transform unstructured records into a structured format ready for a relational database.
Phase 2: Centralized Logic with SQL Once cleaned, you will migrate your data to a SQL Database. Instead of doing math in your dashboard, you will learn to "centralize" your logic. You will write complex queries to create Aggregated Views. By pre-calculating metrics like Strike Rates, Economy Rates, and Phase-wise Performance in SQL, you ensure your analytics are fast, reusable, and trusted.
Phase 3: Strategic Visualization with Power BI In the final stage, you will connect your SQL views to Power BI. You will design interactive dashboards tailored for coaches and analysts. Your focus will be on Decision-Ready Design, creating visuals that highlight match-ups, player vulnerabilities, and venue trends that actually influence game day strategy.